

|
The Project Part 1: Part 2: Part 3:
| Daily JournalJanuary 31, 2005:
|
Terri, Richard, and Brian wait as Rob works on fixing the computer.
Richard is pretty excited to be awake right now. What’s that on Fred’s computer? |
Today was a long day, due to technical difficulties on the New Horizon. The computer that tells the CTD when to collect water and stores the data from the instruments on the CTD has been having problems. We went through two computers and tried to use Richard’s laptop, in hopes that we could install the proper software and get the CTD going to collect water. This is a big deal, as we are out in the Sea of Cortez for less than 8 days, and each day costs around $13,000 for the scientists. Therefore a lot of sampling is crammed into the schedule, so that as much information can be gathered in this short time frame as can be allowed. This means that even a short-term delay can cause the schedule to get off, and may lead to the cutting of some tests.
In the mean time, we sat and waited in the hopes that Rob, the ship’s technician, could fix the problem. He’s very knowledgeable in computers, so we’re glad he’s along. Luckily, a few hours later, he had the problem fixed and four hours after scheduled, we were able to collect the water and run our tests. With a little finagling of the schedule (and lots of hope that the computers behave), we’re back on track and back on our feet. (And man, they’re beginning to hurt!)
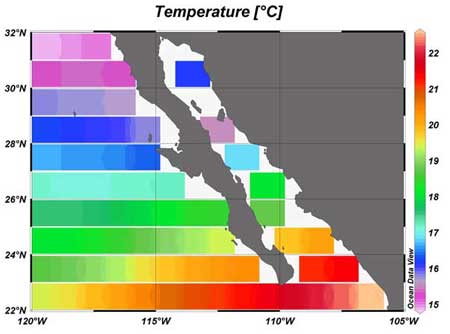
Q: Below is a plot of temperature at the surface of the ocean. Plot 1 shows the average temperature for January through March. Find where we are using the web site, and using this plot estimate the average temperature for our location. The temperature of the water at the surface where we were today was measured to be 18oC. How does this compare to the plot? (What is this temperature in Fahrenheit degrees?)
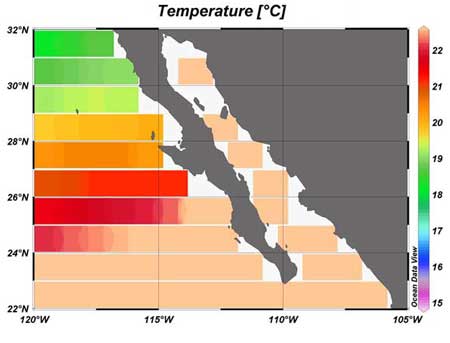
Plot 2 shows the average temperature for the sea surface from July through September, which is when we’ll be coming back out this summer to repeat and run other experiments. How does this plot compare to Plot 1? What are some potential reasons for their difference?

Plot 1: Plot of the average temperature
for the sea surface from January - March

Plot 2: Plot of the average temperature
for the sea surface from July – September
![]()


