

|
The Project
|
September 1, 2005
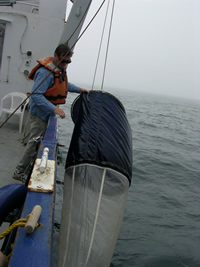
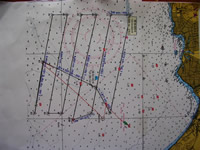
The science team on the New Horizon conducted a 24-hour survey while anchored at station in the Monterey Bay. Surveys so far have consisted of wide band surveying, smaller band surveys, and now the surveys include 24-hour single station surveys. All the surveys combined will give us a good three-dimensional picture of the dynamics of some of the smallest critters in the sea, the phytoplankton and the zooplankton. The overall survey area was plotted on the map even before we reached the area. When we entered the area, we began surveying stations at distances of three miles apart. Within the large area we began pinpointing areas where thin layers of plankton were occurring and how this related to the ocean currents (water flowing) in the bay. Surveying on a smaller scale with profile drops at every 600 feet we were able to find the extent of each thin layer section. With last night’s 24-hour survey at one station we were able to see the thin layer’s response to time. Some of our observations have been exciting to the group in the lab. Yesterday the ship crossed a distinct current change. The change was visible while looking out over the surface of the ocean. A long six-foot wide band of surface foam created a streak across the bay in a northwest to southeast direction. On the inshore side of this narrow band the current was moving northwest while, just a few feet away, the ocean side of the band was moving southeast. Locating currents and monitoring their change over time is a big part of being able to predict the movement of thin layers over time. A zooplankton tow is done at some of our observation stations. A plankton tow means lowering a large net to near the ocean floor. The net is then raised up through the water at a constant speed. The samples that we have collected during the presence of a thin layer show that there are a lot more plankton concentrated within the thin layer then during times when a layer is not present. At 2 AM on September 1, during our 24-hour study, most people were asleep when each of the three layer monitoring systems (the lidar, the echo sounders, and the profiler) detected a distinct thin layer of plankton. The scientists on duty tracked this thin layer for several hours and watched the layer change as time passed. Math The dimensions (length and width of sides) of the survey area are 10 east/west miles by about 8 north/south miles. The area looks like a parallelogram, which looks like a rectangle that has been pushed sideways and flattened slightly. It has four straight sides, with opposite sides equal and parallel (hence the name parallelogram). Find the area of the parallelogram-shaped survey area using the formula: Area = Length (base) times height (A = l x h) where the height equals 7.4 miles and length equals 10 miles. To solve: First draw a picture and label the length of the base and the height (remember the height is a perpendicular line drawn from the base to the top corner of the parallelogram) then substitute the known values into the equation and solve.
|


