

|
The Project
|
August 20, 2005
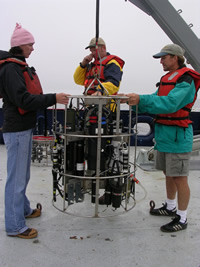
Testing Compass Direction on a Coordinate Grid Early in the morning the research vessel New Horizon arrived at our planned research site. Most everyone was still asleep however I immediately sensed that the ship was no longer moving forward. Instead of the bow to stern rocking motion of the ship plowing forward through the waves there now was the side to side motion of a ship mostly stationary in calm waters. The ship is never completely powerless because in order to maintain control of the vessel the captain and mates must maintain a forward motion of about 0.7 knots, which is less than one mile per hour. Try driving a car at one mile per hour and you will soon see that it is very difficult. Ships are designed for slow speeds and with the automatic pilot function the going is slow but necessary for the testing that will be done today. As individual orange transparent jellyfish float lazily along with the currents past the ship, the research team is preparing to test the sensors connected to the circular cage. The array of sensors is positioned to be lowered into the water off the back of the ship (often called the aft or stern deck). The first thing to be tested is the compass that is an instrument that is built into the system. The cage-like array is lifted and rotated while the computer relays the information to the reader in the science lab. The computer screen shows the rotation track on a coordinate grid that looks like a piece of graph paper. Try this: Use a piece of graph paper or draw a grid on a plain piece of paper. Draw a vertical line down the left side of the paper. Draw a horizontal line across the bottom part of the paper. Be sure that these two line cross in the lower left part of the paper. The point where the two lines cross is point (0,0). Now plot the six points (listed below) where the first number is counted off the X or horizontal axis and the second number is counted off the Y or vertical axis. The axis is just like two spokes of a wheel radiating out from the center (0,0) point. Plot points (1,3) (2,4) (4,4) (5,3) (4,1) (2,1) Connect the points in the order listed and you will see what the science team saw on their screen as the instrument was rotated. Now label the compass directions: North is at the top, South is at the bottom, West is to the left and East is to the right. Also, try labeling the points that are Northwest, Northeast, Southeast, and Southwest. Also today, the acoustic team just made some adjustments in the way that their information is collected. Kelly and Chad will now be able to collect about 3 to 4 times the amount of data and this will help with ‘seeing plankton’ in the water. This is great except upon further calculations it was discovered that they will not have enough computer hard disk space (storage space) to back up this large amount of information. A call is being made to have additional hard disks delivered to the New Horizon by one of the smaller research vessels. It seems that no challenge to too great for this group of dedicated people.
|


